Spend Explorer
See every dollar, by service, account, region, and tag.
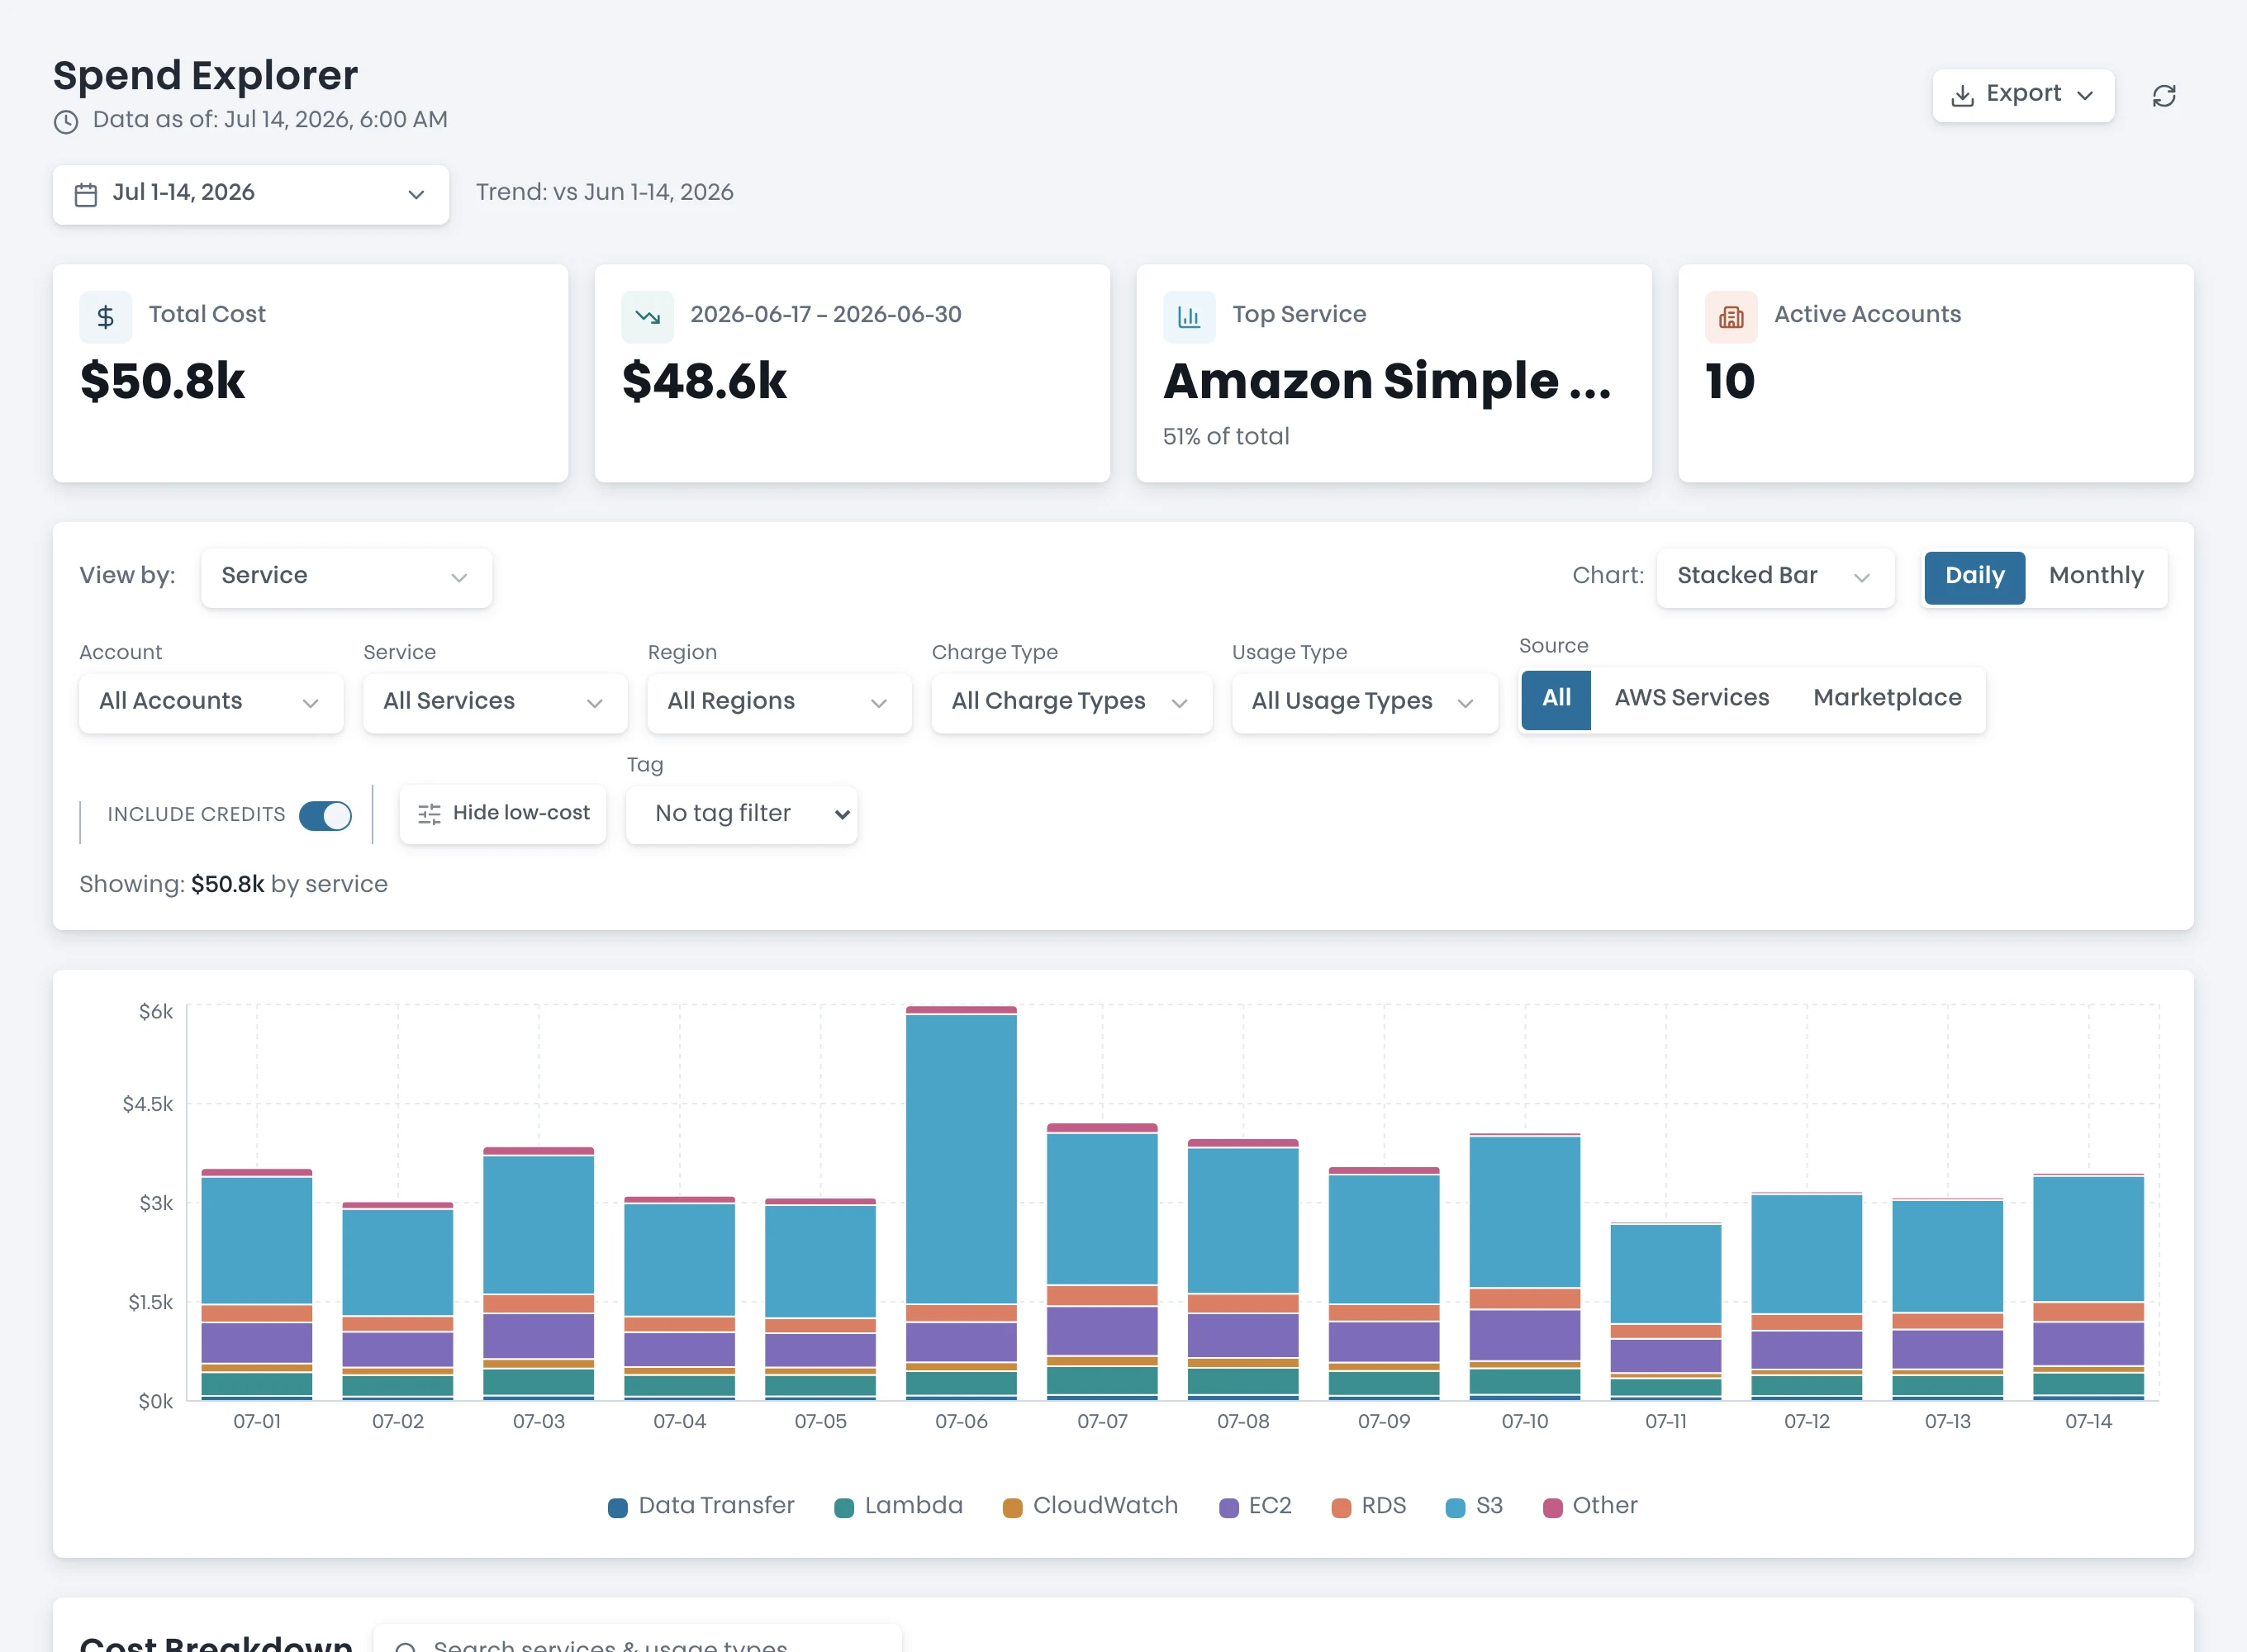
The scan finds the savings; Spend Explorer shows the whole bill. Connect your Cost and Usage Report once and get ongoing spend intelligence without building your own cost pipeline.
The reason to stay after the scan.
Cutting unused spend is a one-time win. Spend visibility is the ongoing discipline, and it's the part most teams never get around to building themselves.
Cost explorer & breakdowns
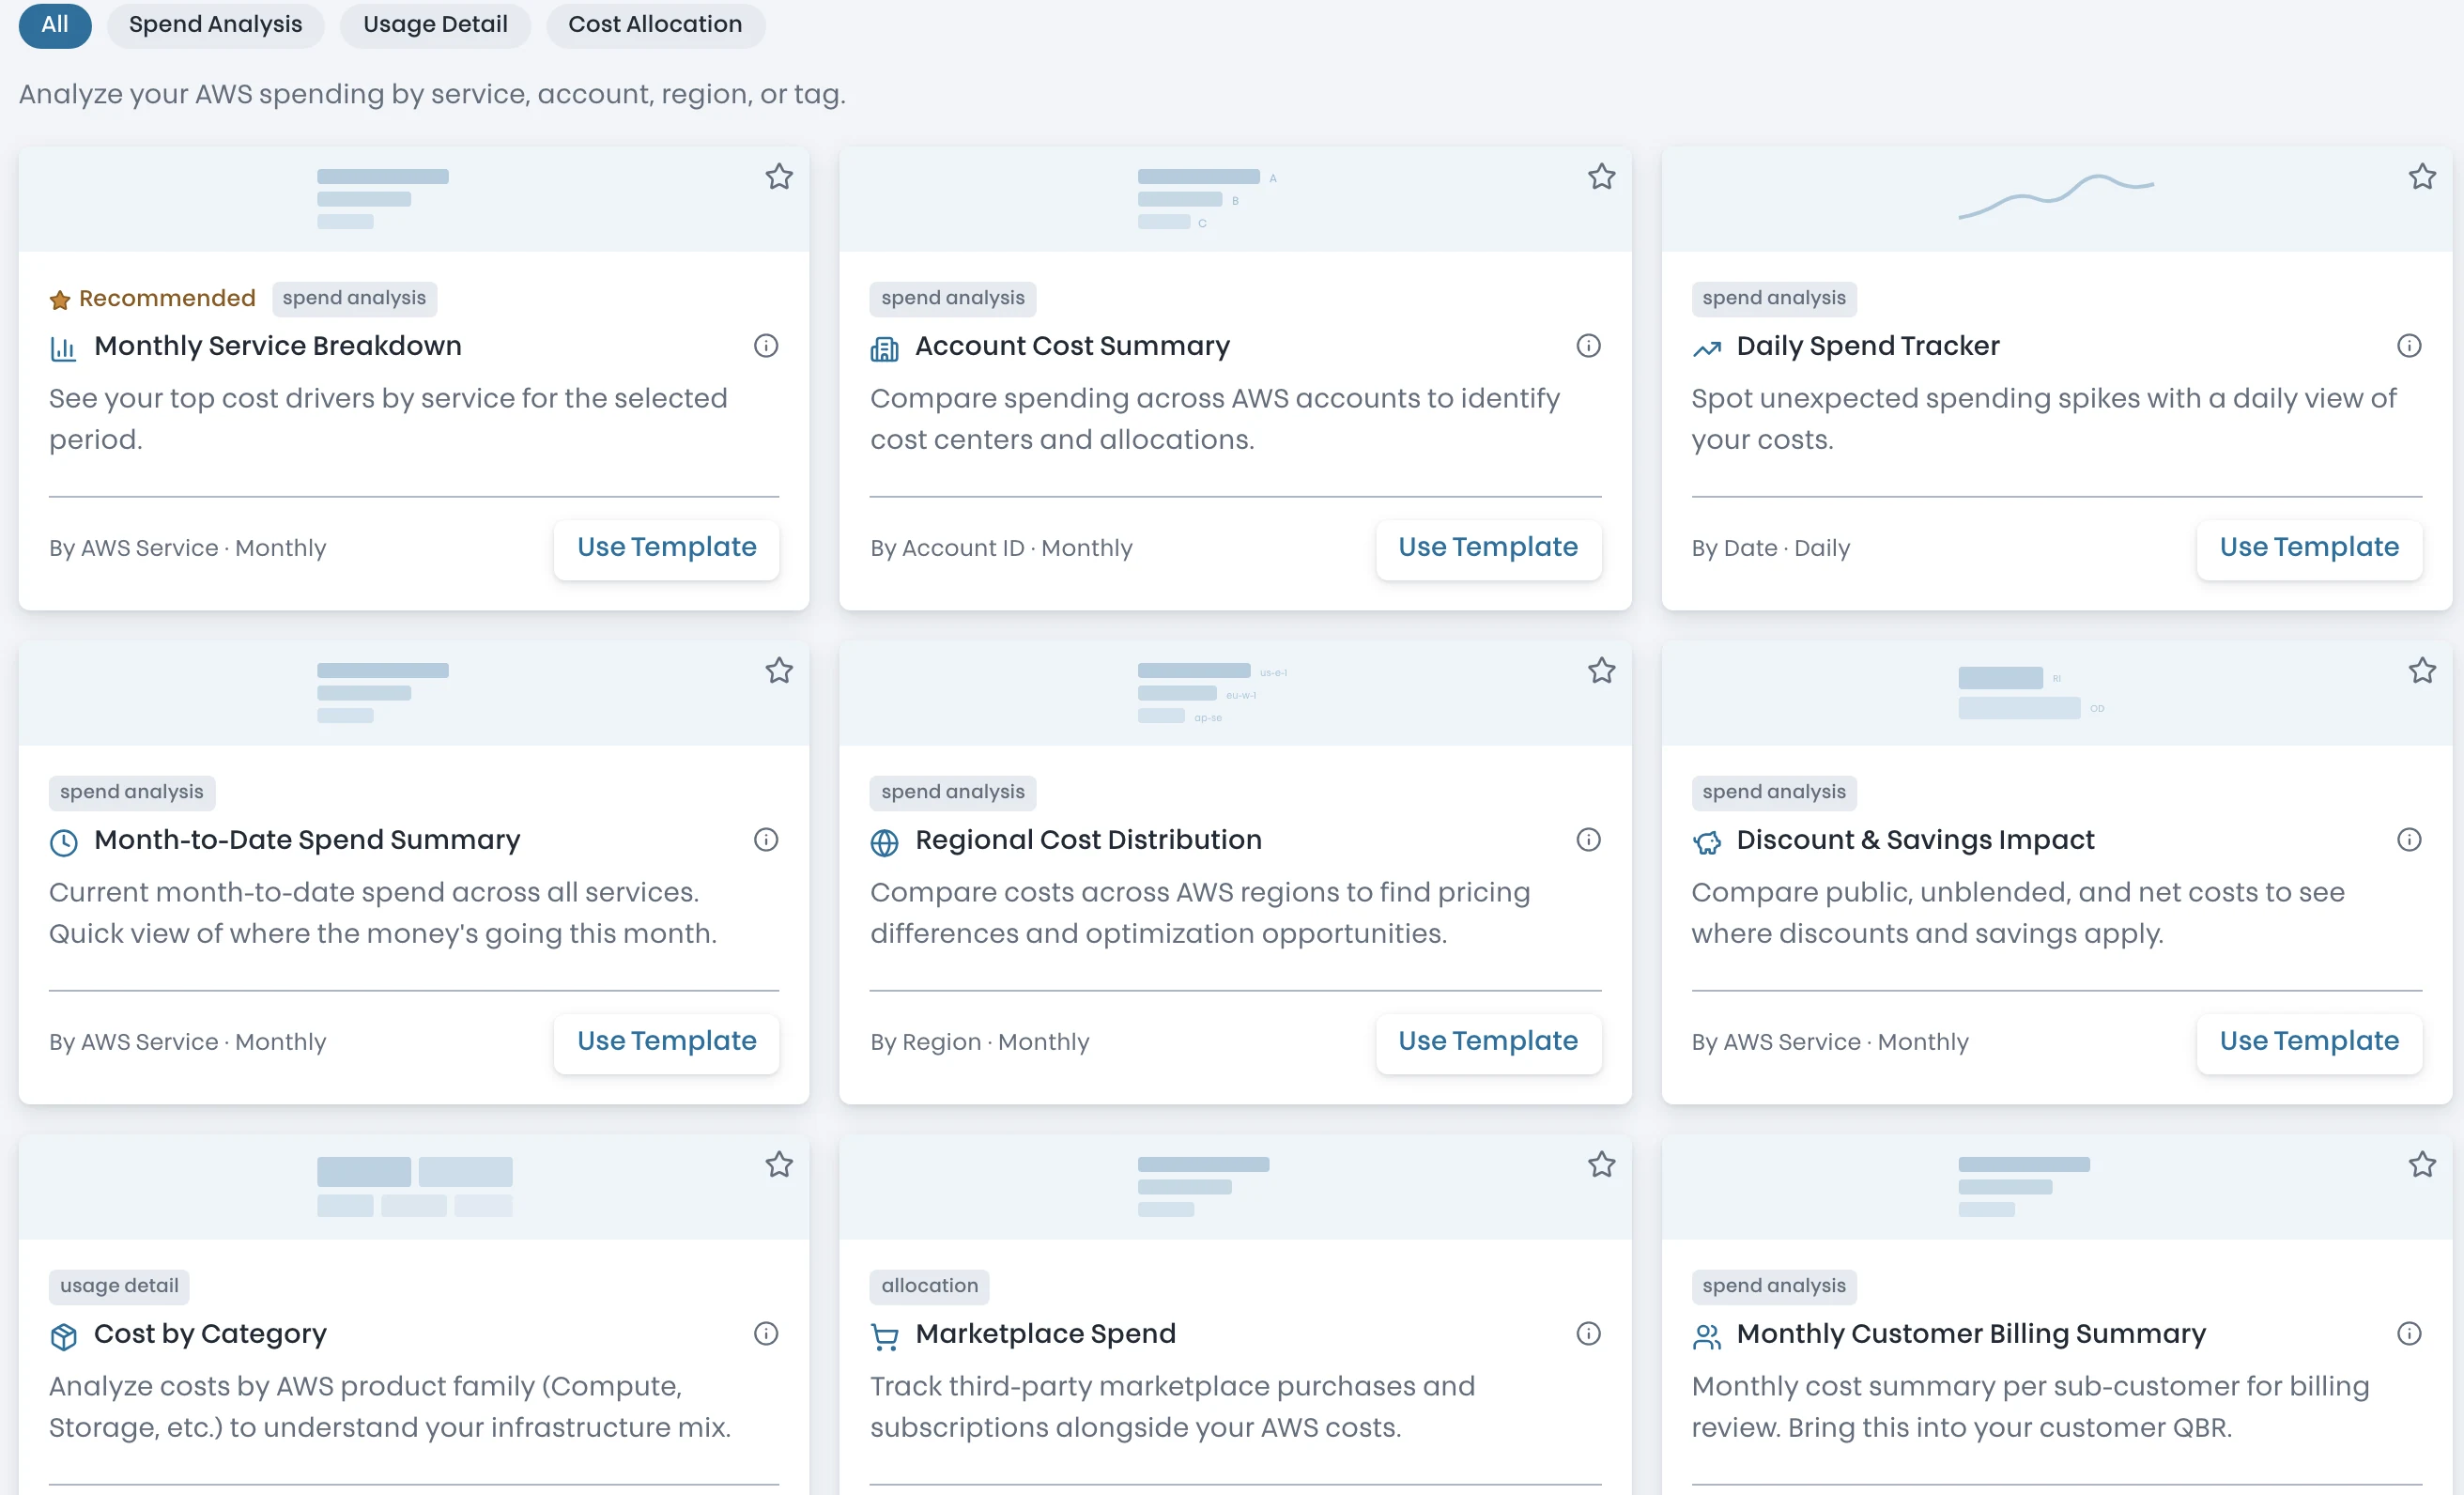
Slice the bill any way the question demands: by period, account, service, region, or tag. Drill from a monthly summary to daily trends to the individual resource, and compare usage types side by side.
- Summary by period, account, and service with daily trends
- Tag-based grouping and dimension discovery
- Resource-level drill-down and a usage-type Compare tab
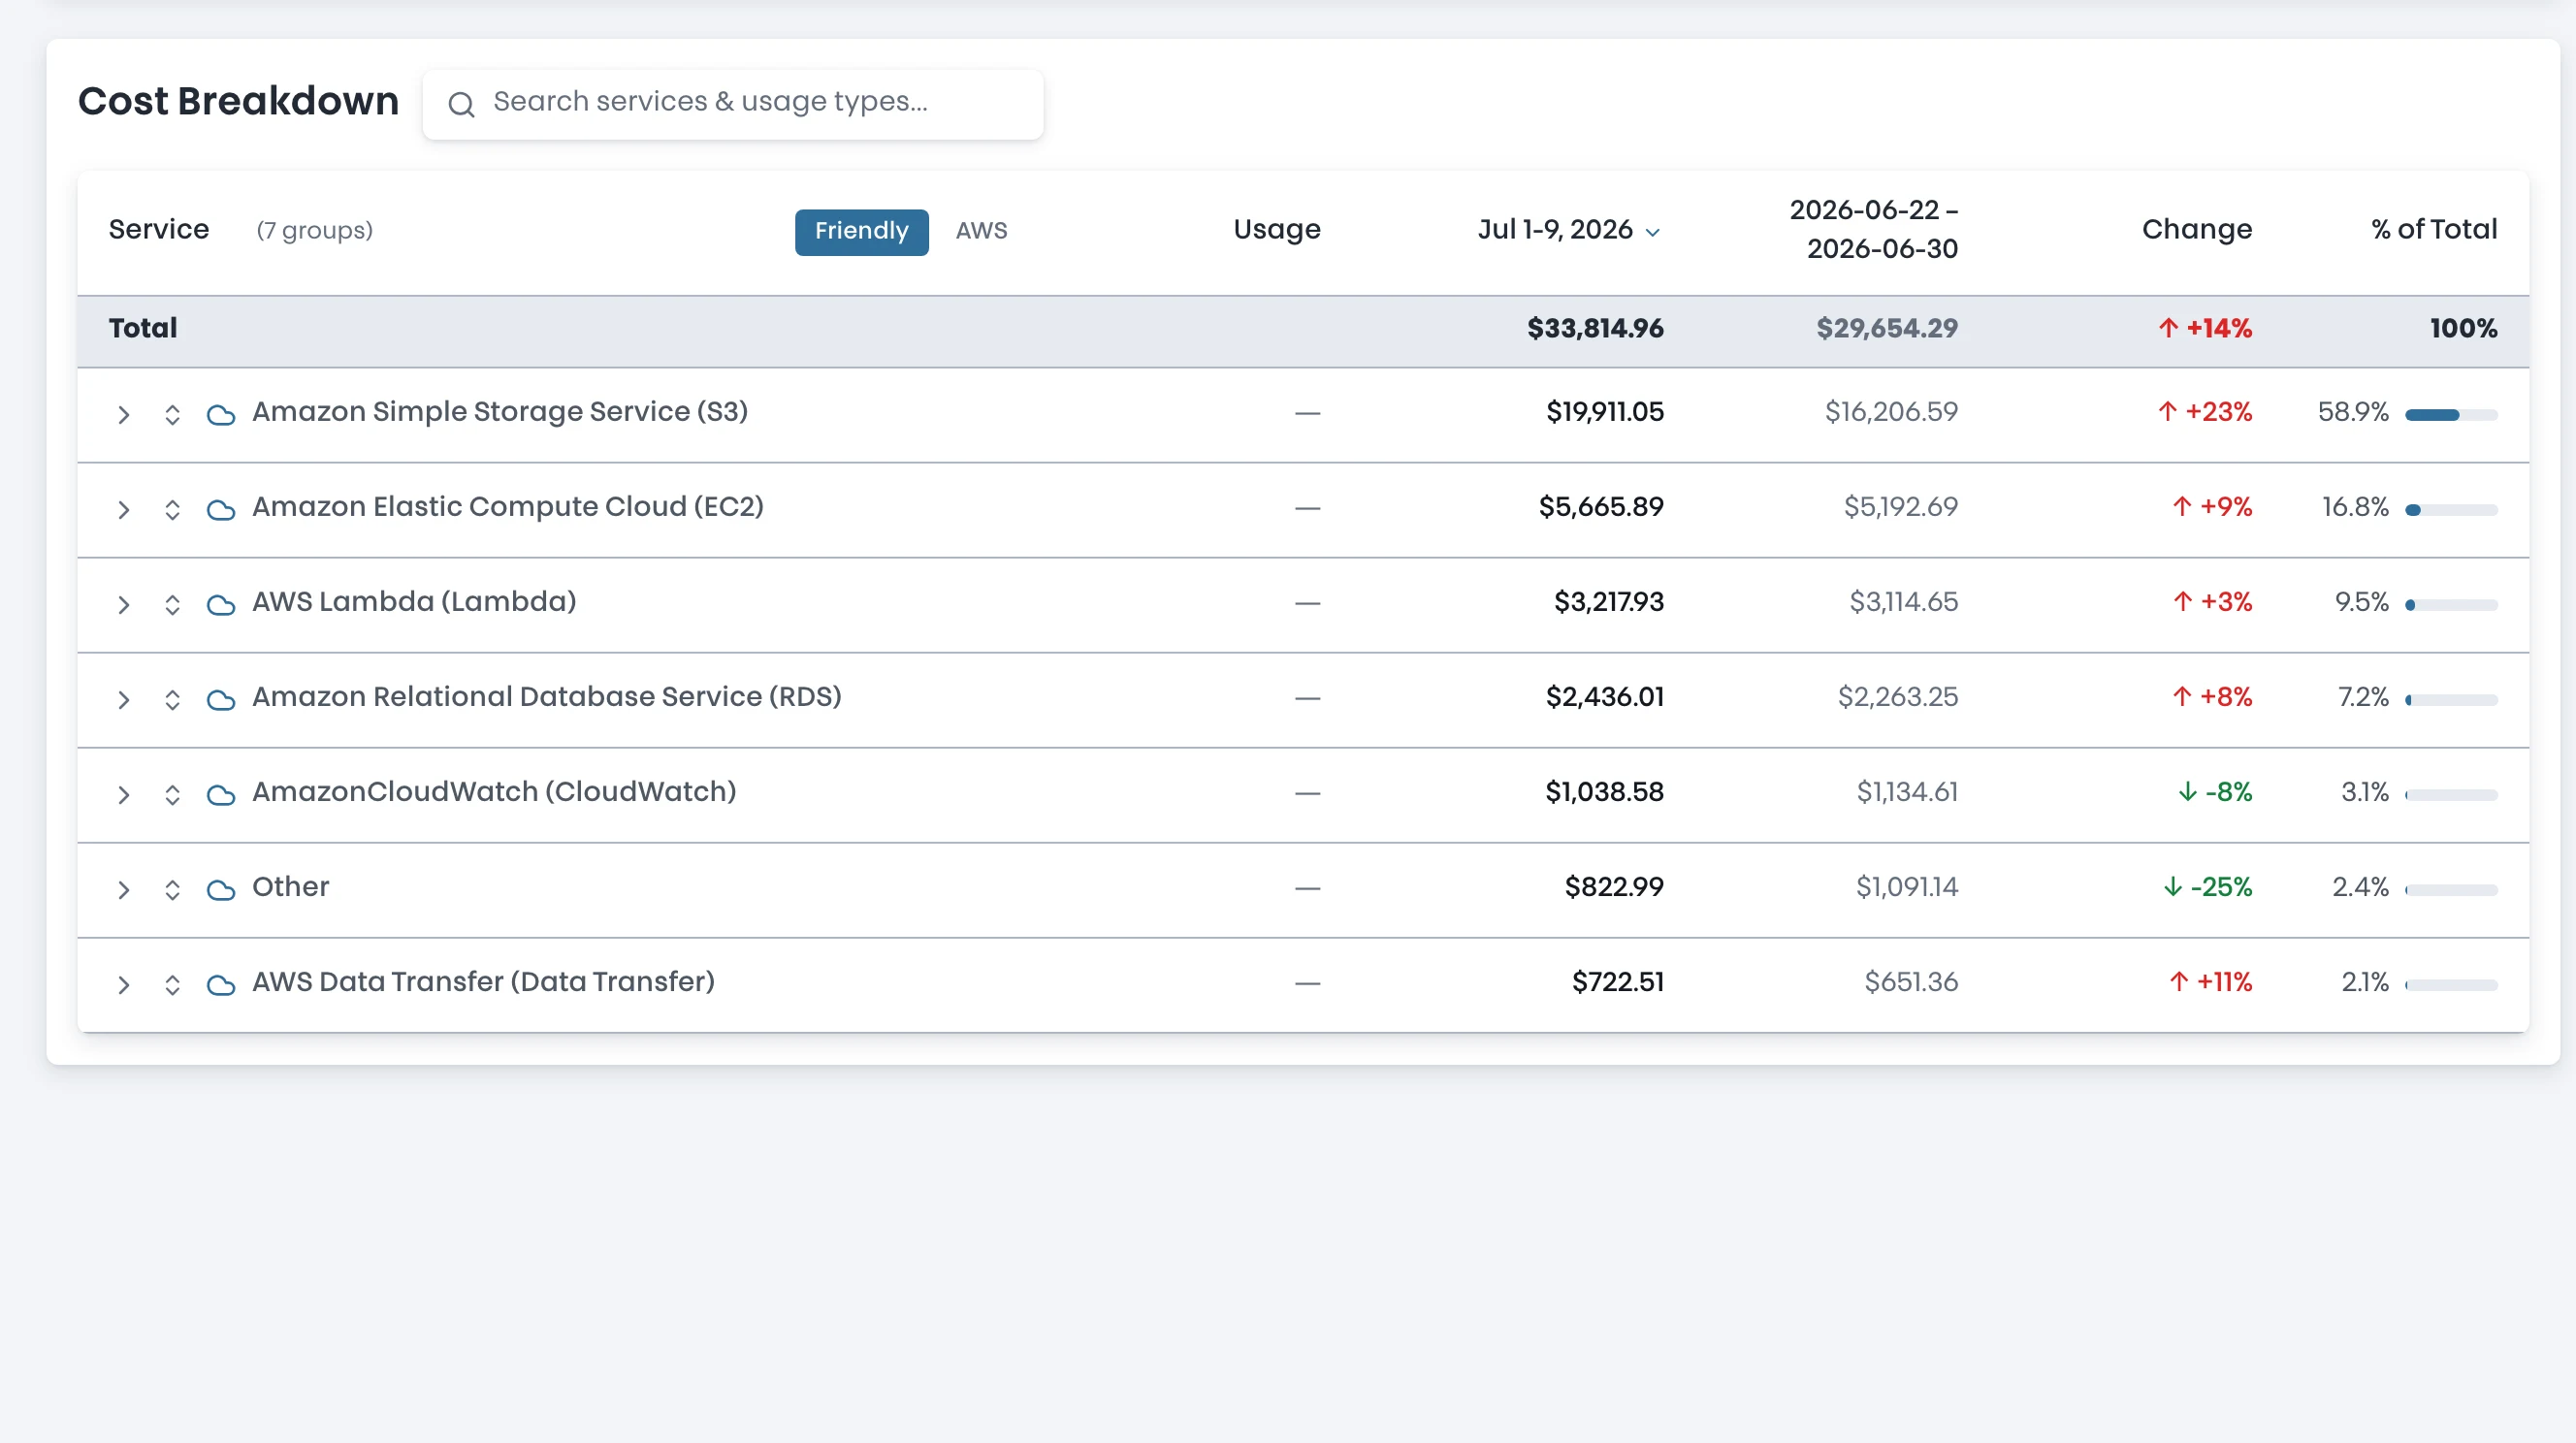
The top service, ranked
Forecasting you can interrogate
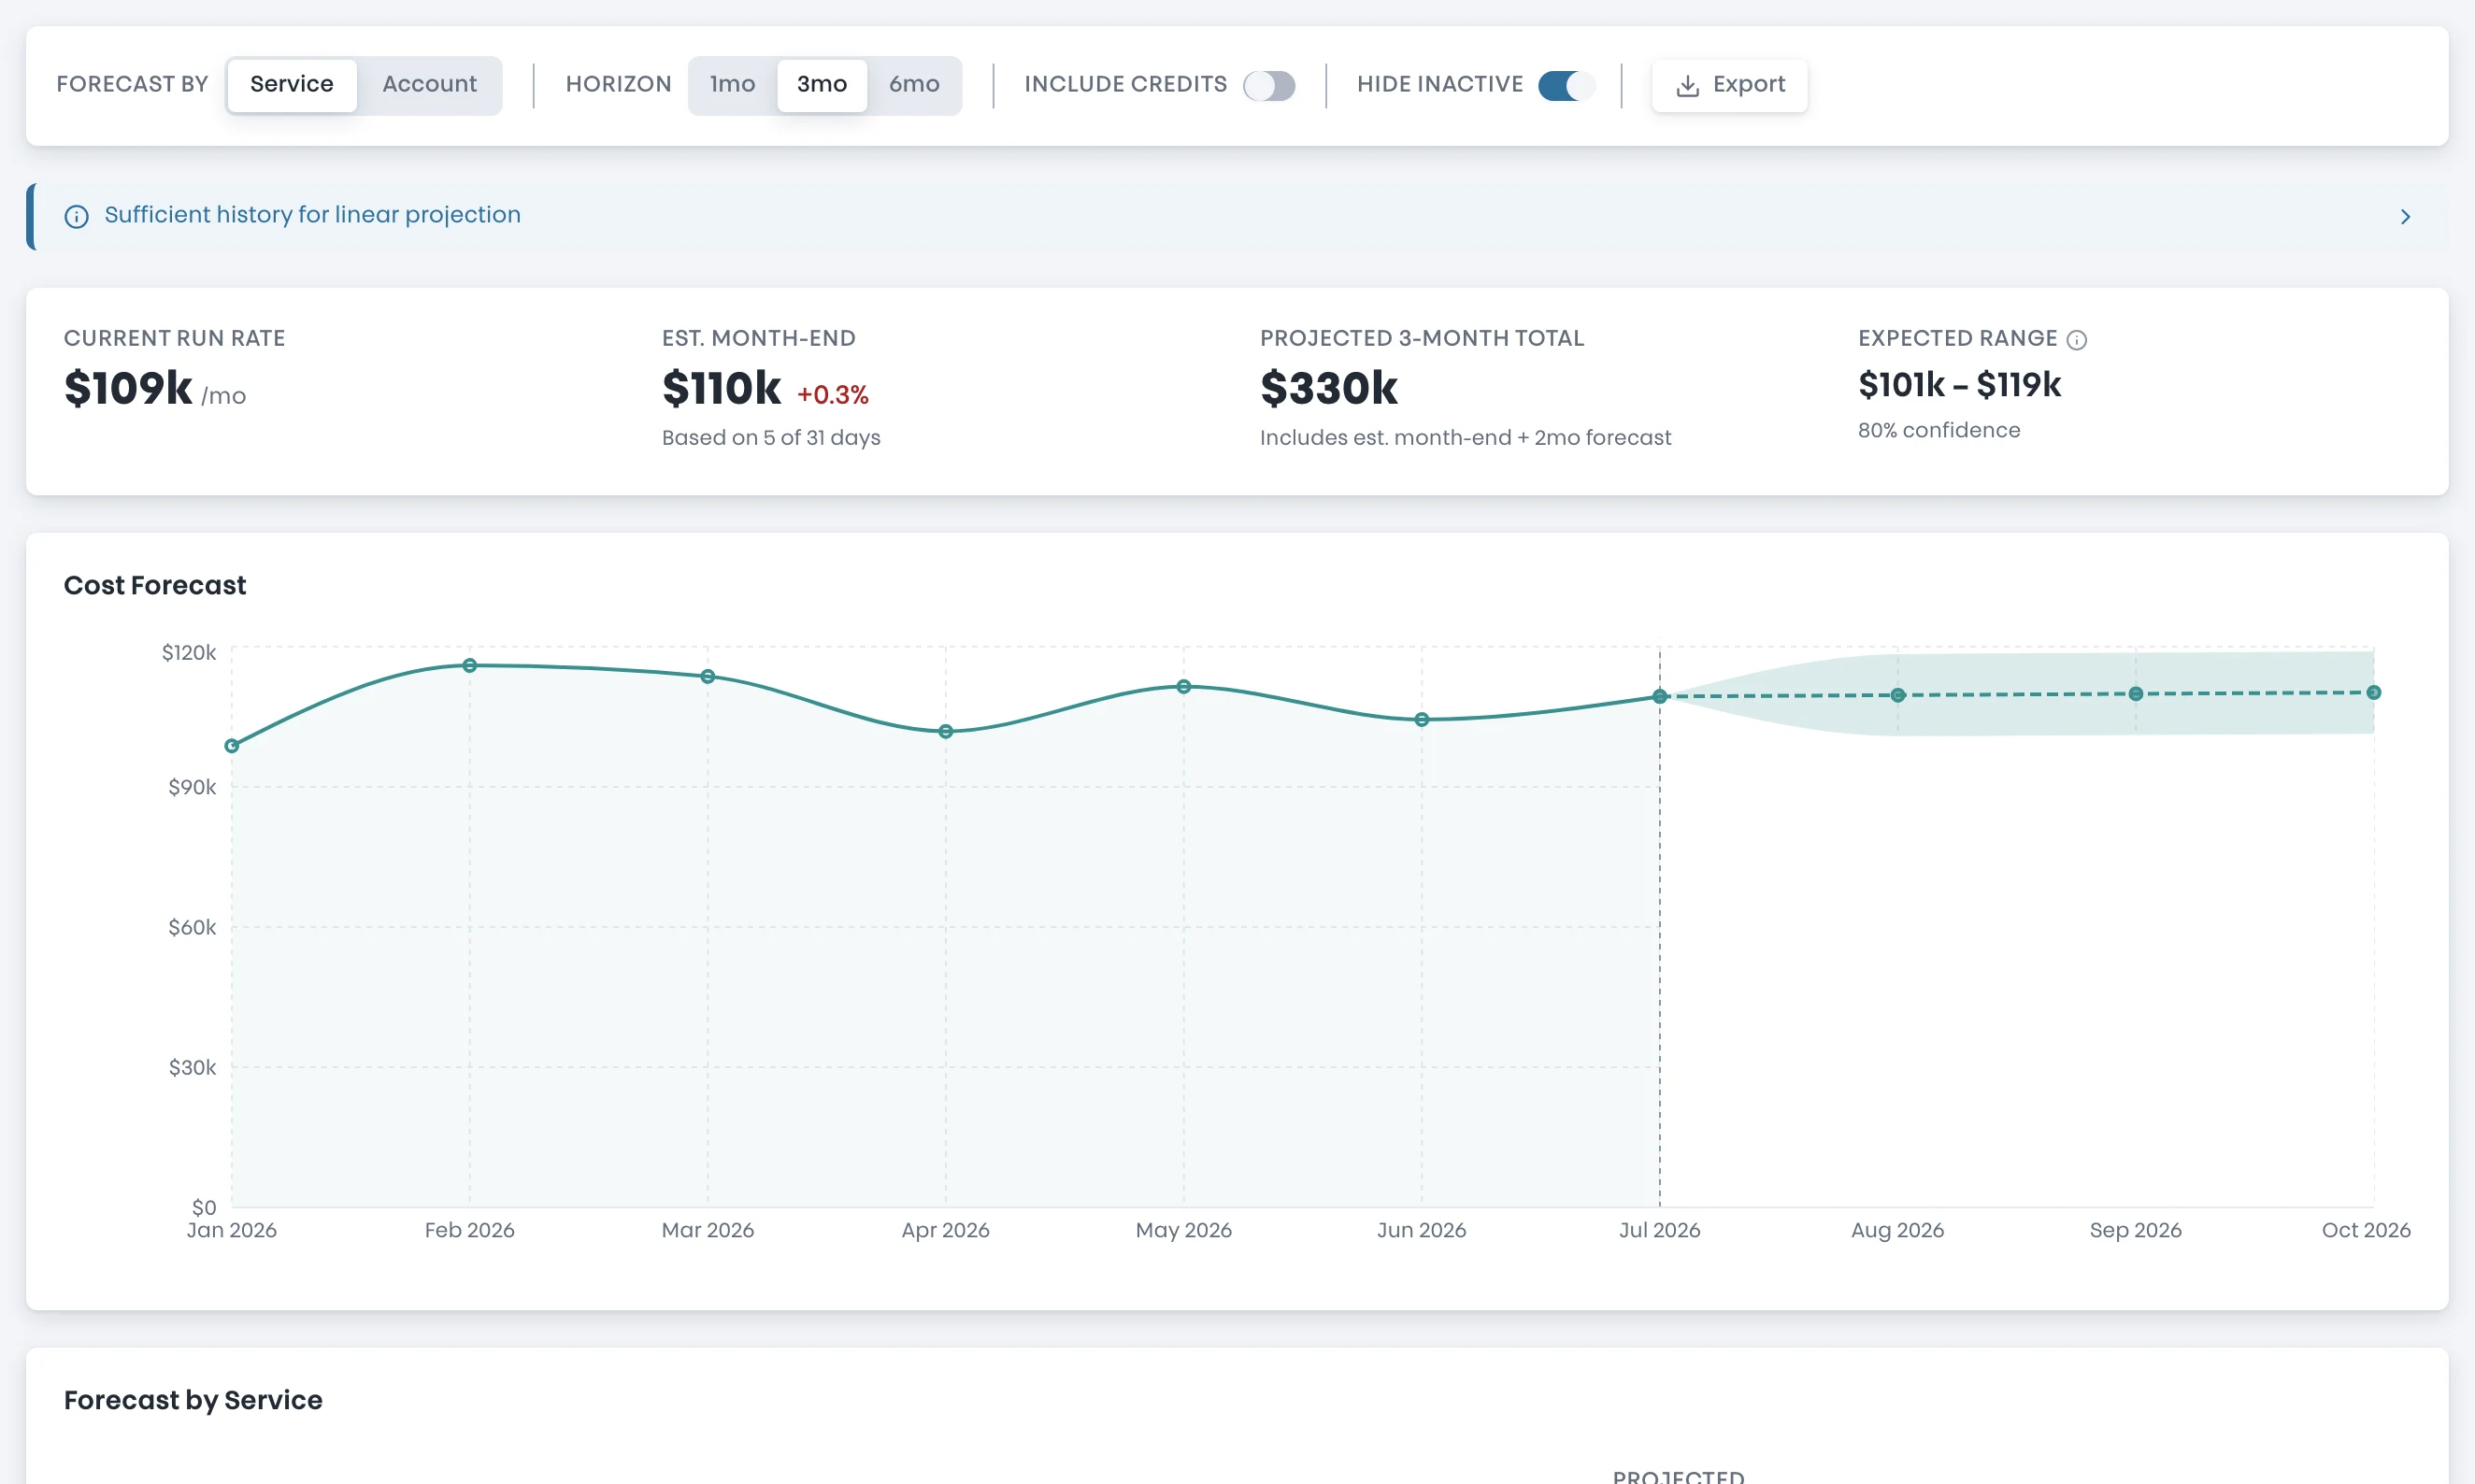
Spend forecasts use ETS models with an expected range, and every forecast is backtested against your own history, so "where will the bill land" comes with an error bar, not a single confident-sounding number.
- ETS-based forecasts with an expected range
- Backtest validation against your actual history
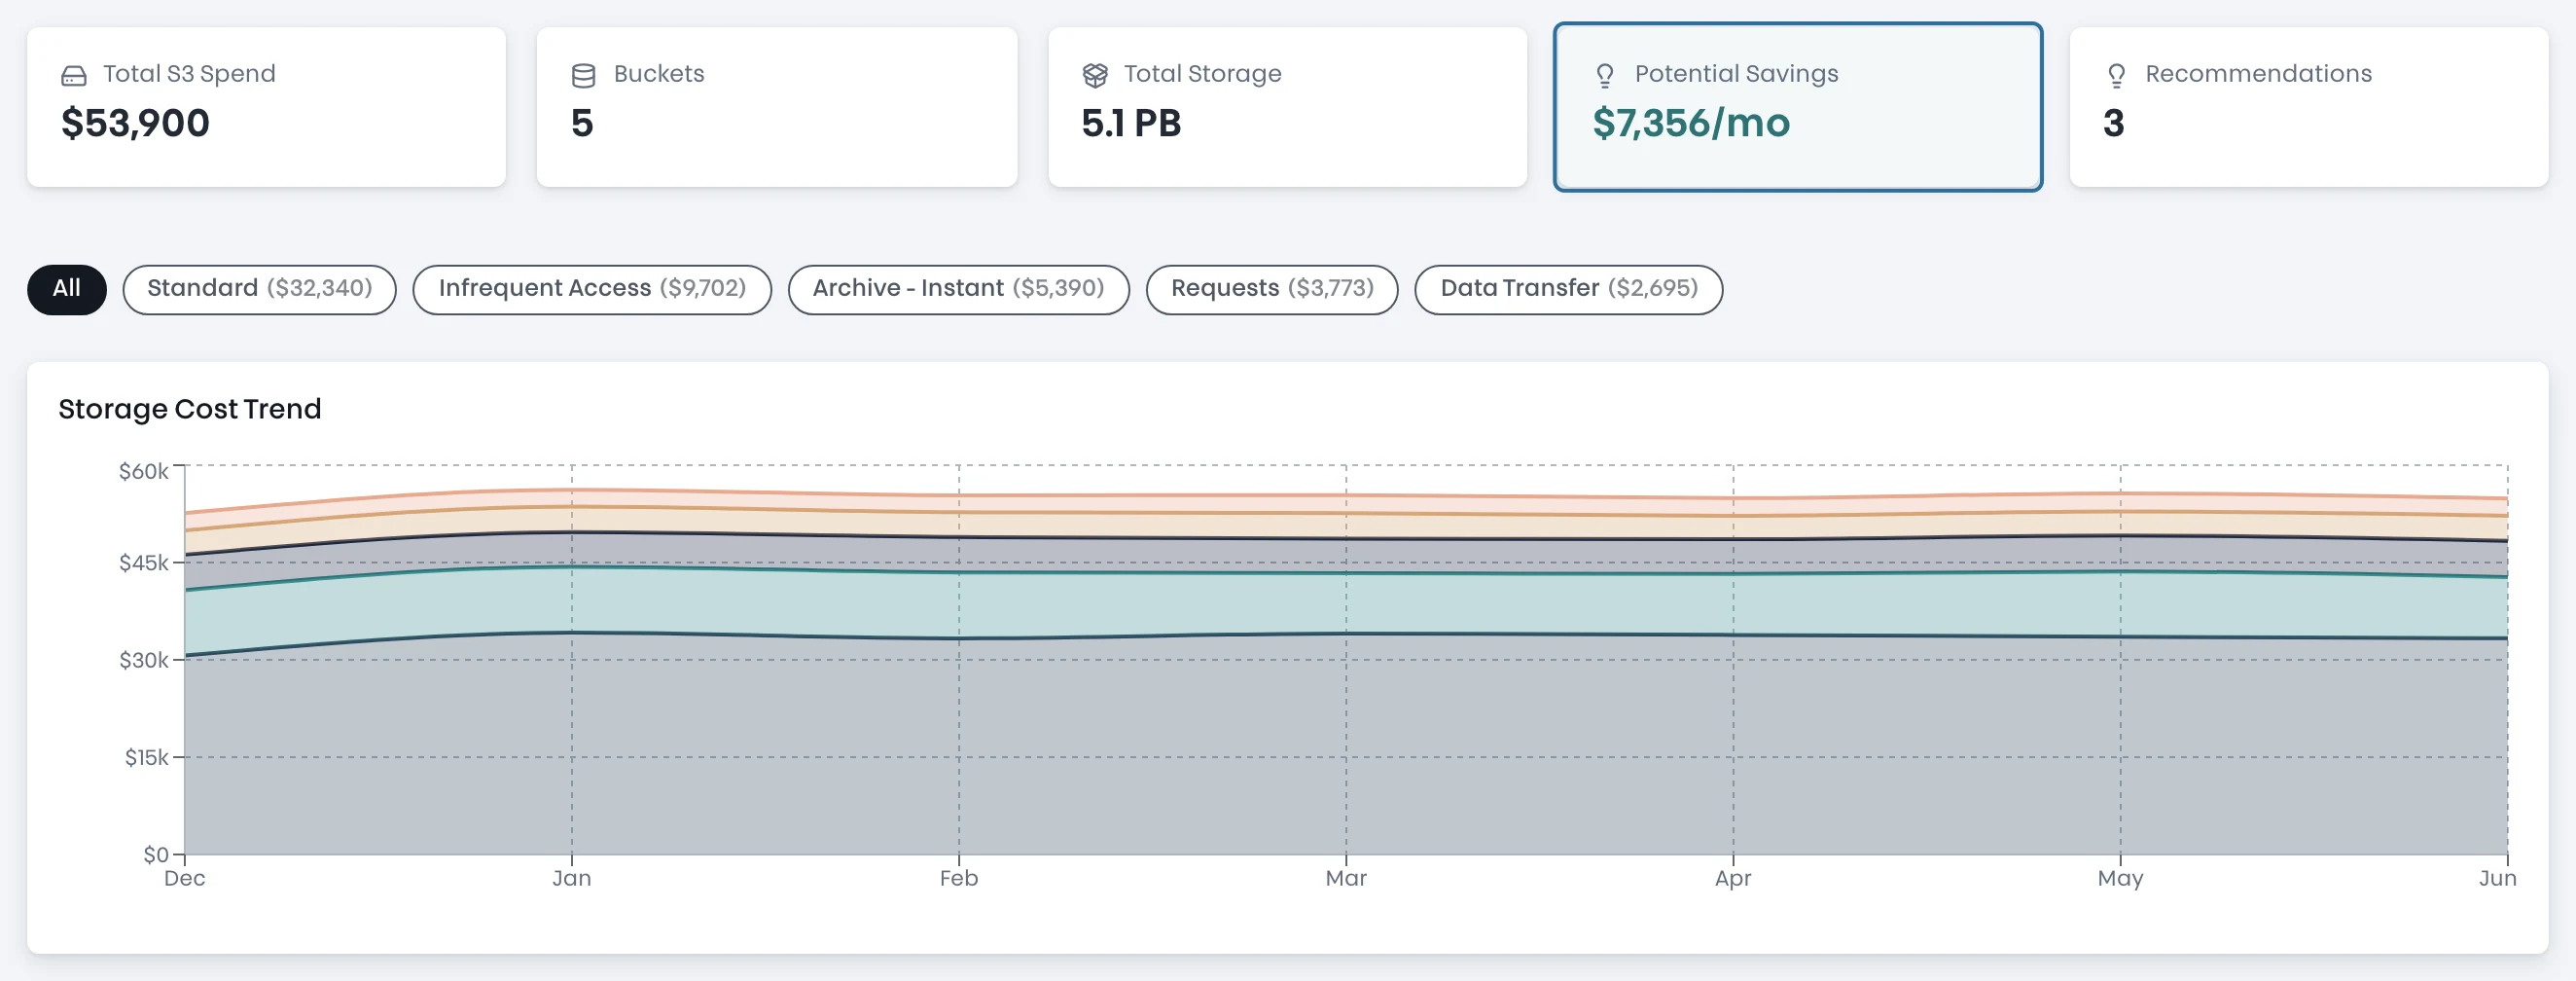
S3 Storage Optimizer
Per-bucket tiering recommendations across Standard-IA, Intelligent-Tiering, and Glacier, with the hidden costs (retrieval, transitions, minimum durations) priced in before you commit.
- Per-bucket recommendations with a savings calculator
- Hidden-costs panel: retrieval, transition, and minimum-duration charges
Reports your team will actually read
A custom report builder with a column picker, multi-dimension filters, and saved templates. Export to CSV or JSON. All of it runs on a Rust query engine reading columnar cost data, so big accounts stay fast.
- Column picker, multi-dimension filters, saved templates
- CSV / JSON export
- Rust-powered queries: results in seconds, not spinners
Honest scope: the complimentary scan needs no CUR. Spend Explorer reads your Cost and Usage Report. Connecting it is a one-time setup the platform walks you through.
FOR MSPs
The whole client book, one spend view.
The MSP portal isn't the customer product with more tabs. It's built around the portfolio: every client's savings, spend, commitments, and security, payer-grouped in one place.
- Multi-tenant roll-ups
- Portfolio totals with per-customer breakdowns one click deep.
- Per-customer scoping & margin
- MSP-private discounts filtered so sub-customers never see your margin.
- Client-ready reports
- A polished executive summary per client, straight from the portal.
- Org-level onboarding
- One StackSet connects a client's whole AWS organization.
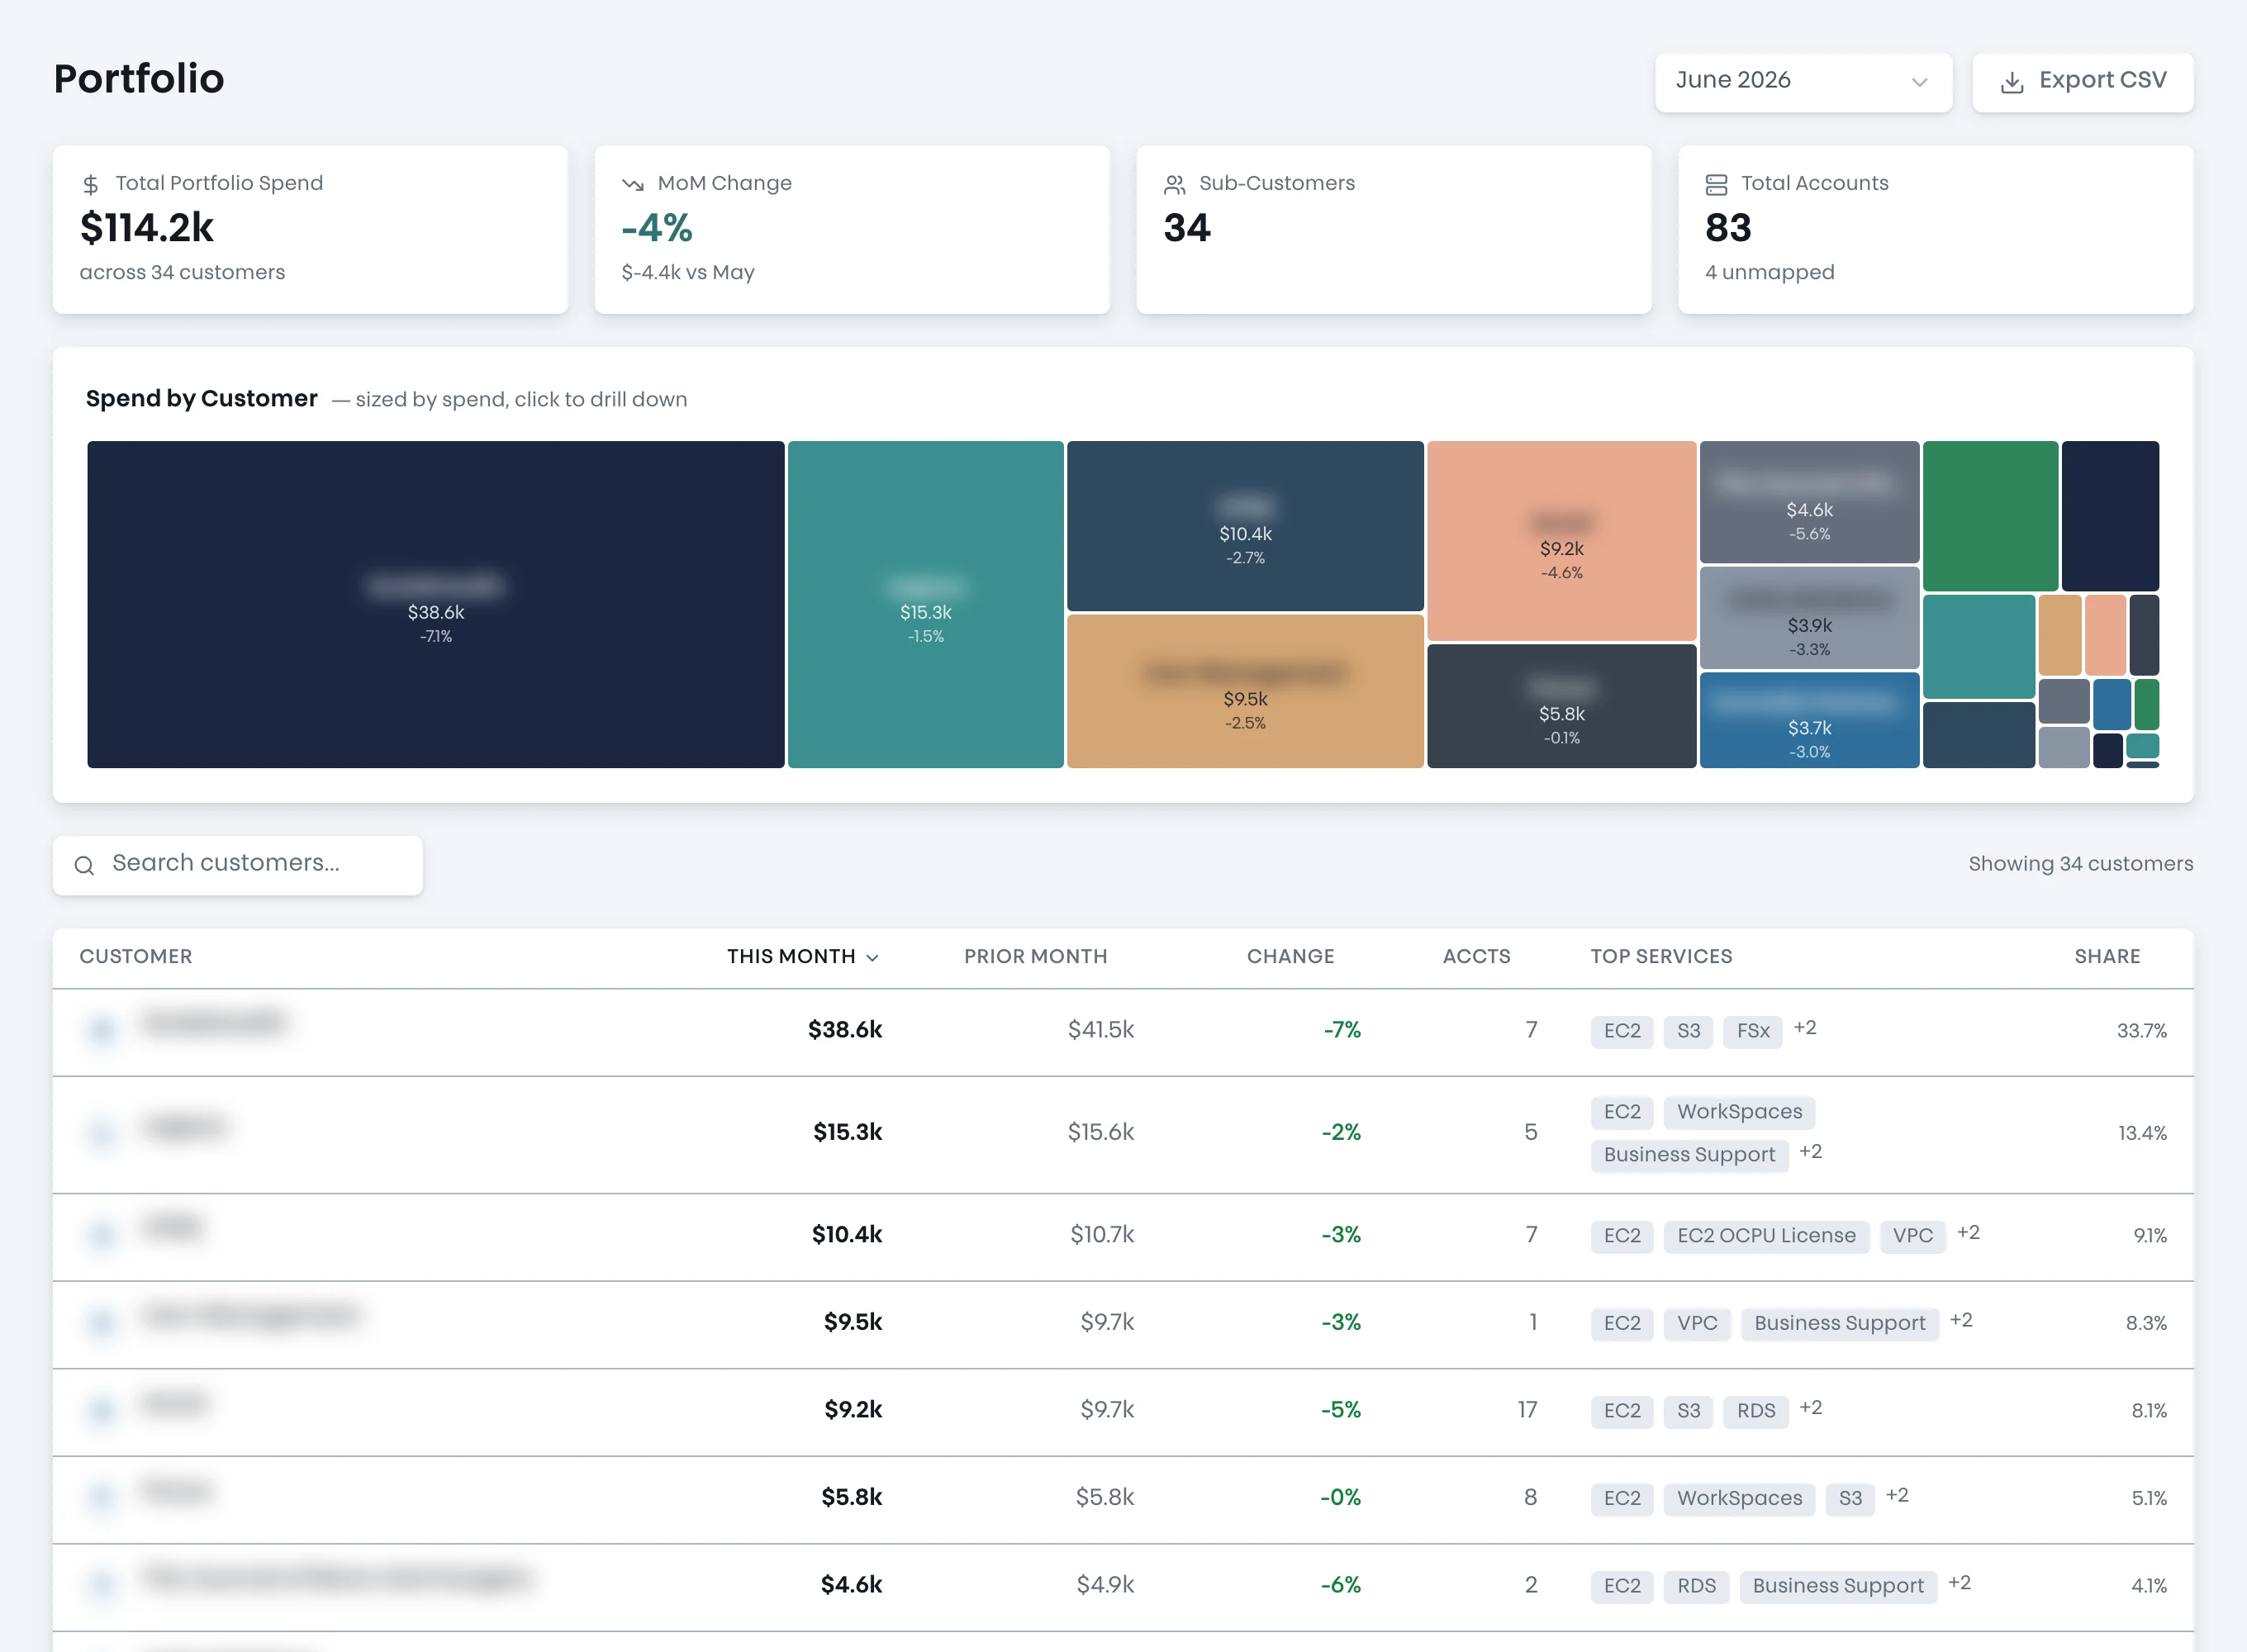
A real MSP's live portfolio: 34 clients, one June, names redacted.
Know where every AWS dollar goes.
Explore the live demo20% median AWS savings identified* · Median savings identified across accounts scanned to date. Your result depends on your environment; the scan costs nothing either way.