
Key takeaways
- More data doesn't mean better decisions. Teams need guidance, not another dashboard
- The real gap isn't visibility, it's knowing what to do next and in what order
- Opinionated recommendations with effort ratings and plain-language steps close the action gap
- Advisory Support fills the last mile when findings exceed in-house expertise
You have more visibility into your AWS environment than at any point in cloud computing history. Cost Explorer tracks your spend. CloudWatch monitors your resources. Trusted Advisor flags best-practice violations. Security Hub aggregates findings from half a dozen services. Budgets sends you alerts when thresholds are crossed.
And yet, your team is no closer to actually optimizing anything than they were six months ago. The dashboards are open. The data is right there. But nothing is happening.
The missing ingredient is not more data or more discipline. What these tools leave out, deliberately, is an opinion about what you should do next.
The Dashboard Trap
AWS native tools are genuinely useful. They're also deliberately neutral. They show you what's happening in your environment without taking a position on what you should do about it. That's by design: AWS serves millions of customers with wildly different contexts, and opinionated defaults would be wrong more often than they'd be right.
For a team with a dedicated cloud architect or an experienced FinOps engineer, neutral tools are a solid foundation. They provide the raw material, and the expert provides the judgment.
But most small and mid-sized businesses don't have that person. The person responsible for AWS is a developer, an IT generalist, or a sysadmin who inherited the console login when the last person left. They can read the dashboards. They can see the numbers. What they can't do is translate a CloudWatch metric or a Cost Explorer line item into a specific, prioritized action, because that translation requires expertise they were never hired to have.
For these teams, a dashboard without an opinion attached is one more thing to interpret, and interpretation is exactly the skill they are short on. It is lab results without a doctor in the room: all the numbers, none of the diagnosis.
When Data Creates More Questions Than Answers
Three scenarios show what this looks like in practice:
The $200/Month NAT Gateway
Even pulling the raw number is a detour into the CLI:
# Isolate the NAT Gateway spend before deciding whether it's worth chasing.
aws ce get-cost-and-usage \
  --time-period Start=2026-01-01,End=2026-02-01 \
  --granularity MONTHLY \
  --metrics "UnblendedCost" \
  --filter '{"Dimensions":{"Key":"USAGE_TYPE","Values":["NatGateway-Hours","NatGateway-Bytes"]}}'
That returns a dollar figure, not a decision. You still have to correlate VPC Flow Logs against service endpoints to know whether a free Gateway Endpoint would even help.
The 43 Security Hub Findings
Security Hub is telling you that 12 findings are critical and 31 are high. That sounds bad. But which ones are actually exploitable in your environment versus theoretical best-practice violations? Is the "S3 bucket allows public access" finding about your marketing site's asset bucket (intentional) or your application data bucket (a real problem)? What's the remediation for each one? How long will each fix take? Without that context, the findings are anxiety-inducing but not actionable. So you close the tab and come back to it next quarter.
The 8% CPU RDS Instance
CloudWatch shows your production database running at 8% average CPU. That seems like a clear candidate for downsizing. But CPU isn't the whole story: what about memory pressure? Connection count? Query latency at peak? Will the next deploy spike it? And if you do downsize, what instance type should you move to? The metrics tell you something might be wrong, but they don't tell you what to do about it or what's safe. So you leave it alone, because the cost of guessing wrong on a production database is a lot higher than the cost of overpaying.
Downsizing on CPU alone is a trap
Average CPU is the metric most likely to get you in trouble. A database can idle at 8% CPU and still fall over on memory pressure or connection exhaustion during a deploy. Any safe rightsizing call has to weigh peak load, memory, and connection headroom together. That's exactly the analysis a raw dashboard leaves to you.
Every one of these scenarios ends the same way: the data surfaces a question, but the team is left to answer it themselves. Most of the time, they don't.
What Opinionated Guidance Actually Looks Like
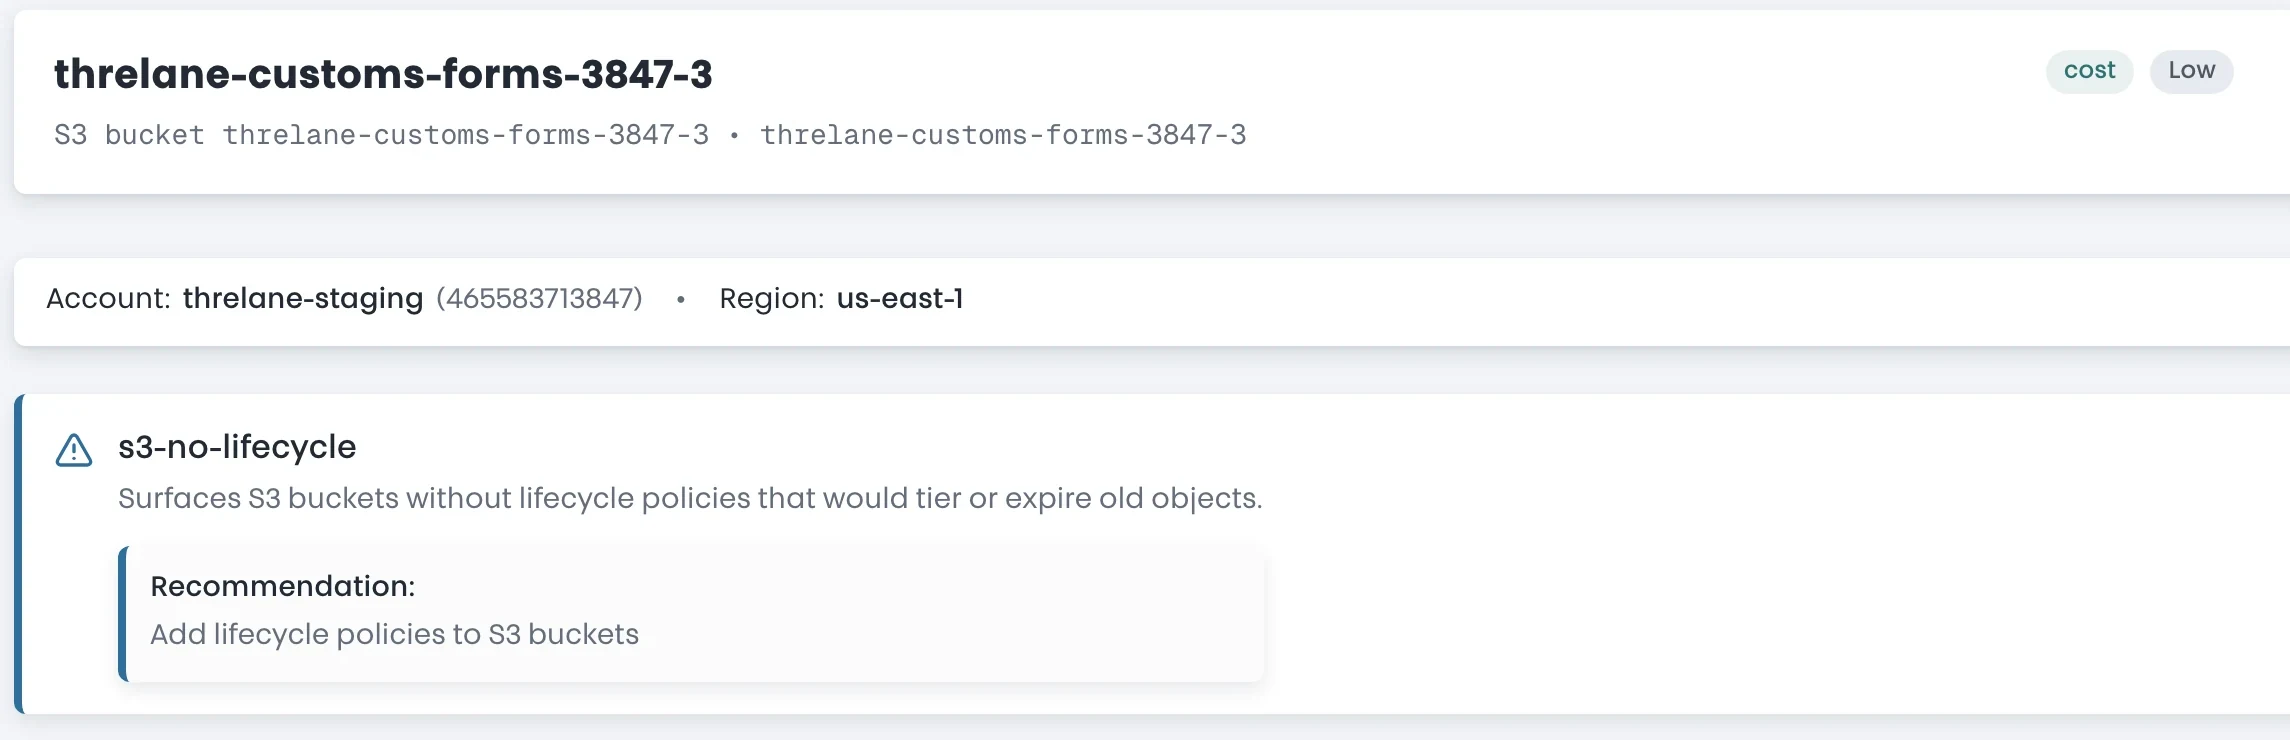
Now imagine the same three scenarios with prescriptive recommendations instead of raw data:
The first version leaves you with a research project. The second gives you a decision: yes or no. The analysis is already done. The context is already there. The effort estimate tells you whether it's a ten-minute fix or a change-window project. And a direct link takes you to the specific resource that needs attention.
This is what opinionated guidance means in practice: "here's what we recommend, here's why, here's how hard it is, and here's where to start."
Stop reading dashboards. Start getting recommendations.
A read-only scan turns your AWS account into a prioritized list of what to fix, what it saves, and how hard each one is.
When You Need More Than a Platform
Even the best automated recommendations have a boundary. Some findings require context that only exists inside your organization: why a particular architecture was chosen, which workloads have seasonal patterns, what compliance constraints apply. Some remediation steps are straightforward for an experienced cloud engineer but intimidating for a team that's never modified a VPC configuration or resized a production database.
Advisory Support isn't a separate product or an upsell. It's bundled directly into the platform experience because the whole point is that customers shouldn't be handed a list of findings and left to figure it out alone. The platform provides the automated intelligence. Advisory Support provides the human judgment. Together, they deliver the kind of environment-specific guidance that would typically require hiring a cloud consultant or bringing on a dedicated operations engineer, without the $15,000-to-$50,000 price tag that puts traditional consulting out of reach for most small and mid-sized teams.